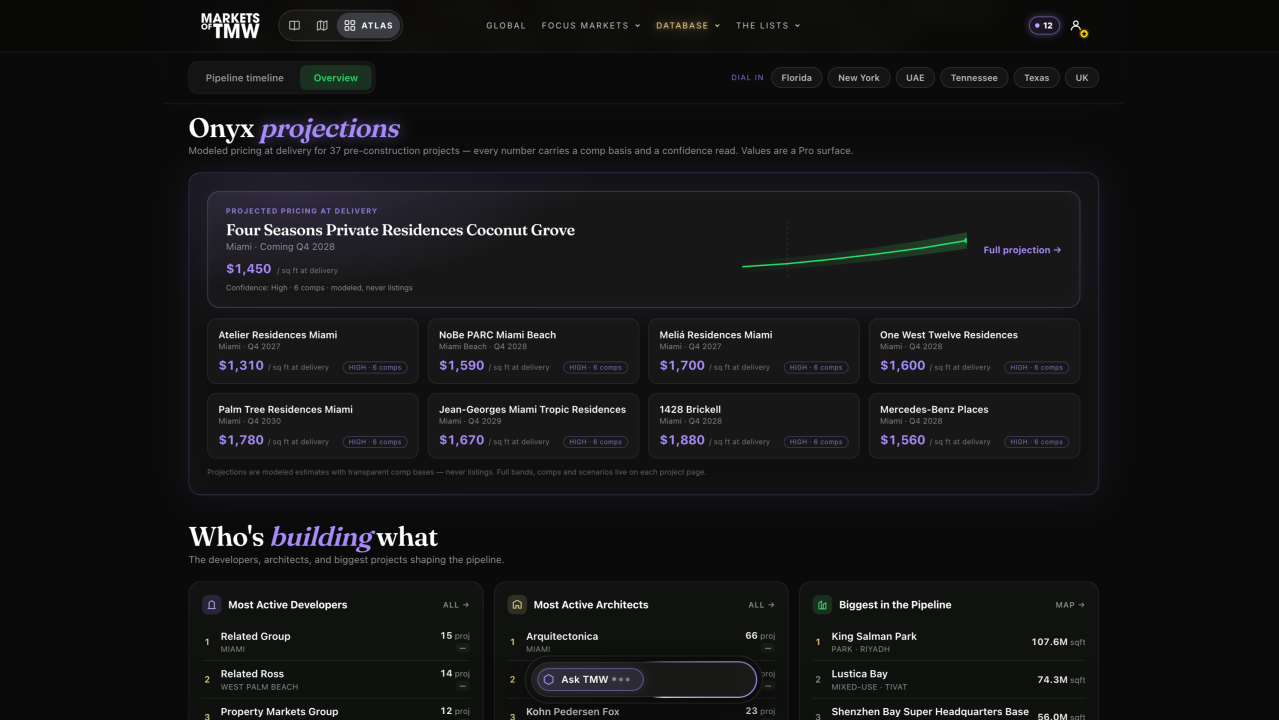
Right now our database is tracking 100+ luxury developments in Miami. Almost 30,000 units. 21 of them are scheduled to deliver inside the next 24 months.
For a while, that is all we told you: that each of those projects had been announced, financed, topped out, and when. A record of what exists. What we did not tell you was the thing that actually matters to anyone with money in the ground, which is what happens when 21 towers try to sell into the same two-year window. This week we taught the database to answer that.
Two weeks ago I argued that the intelligence in what we build does not live in the model, it lives in the graph, the ontology, and the loop. This week we did the two things that only that architecture lets you do. We turned the record into a forecast, and we taught the loop to grade its own work. Here is what shipped.
Supply pressure, or seeing the traffic jam coming
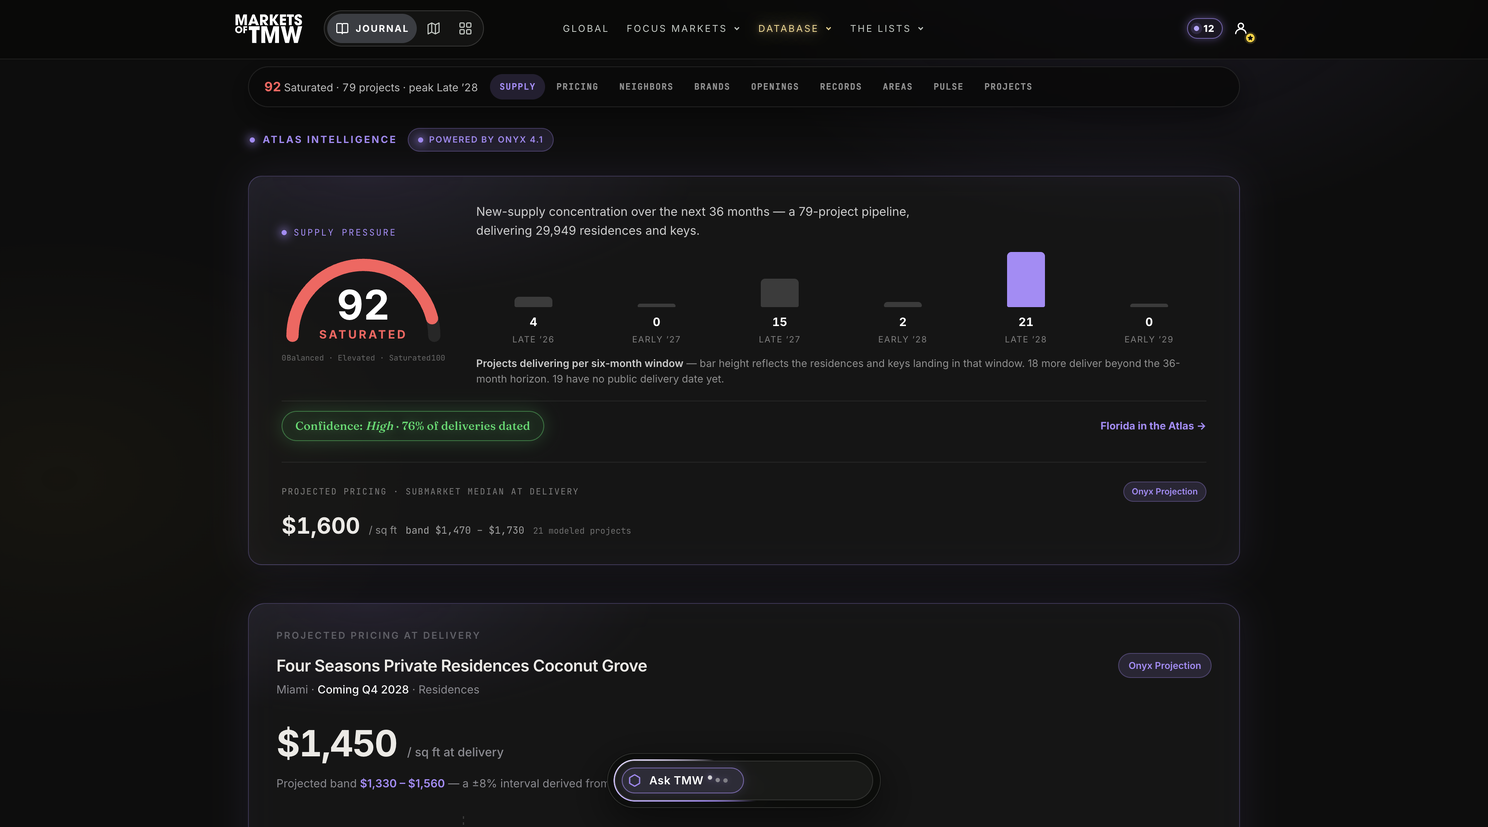
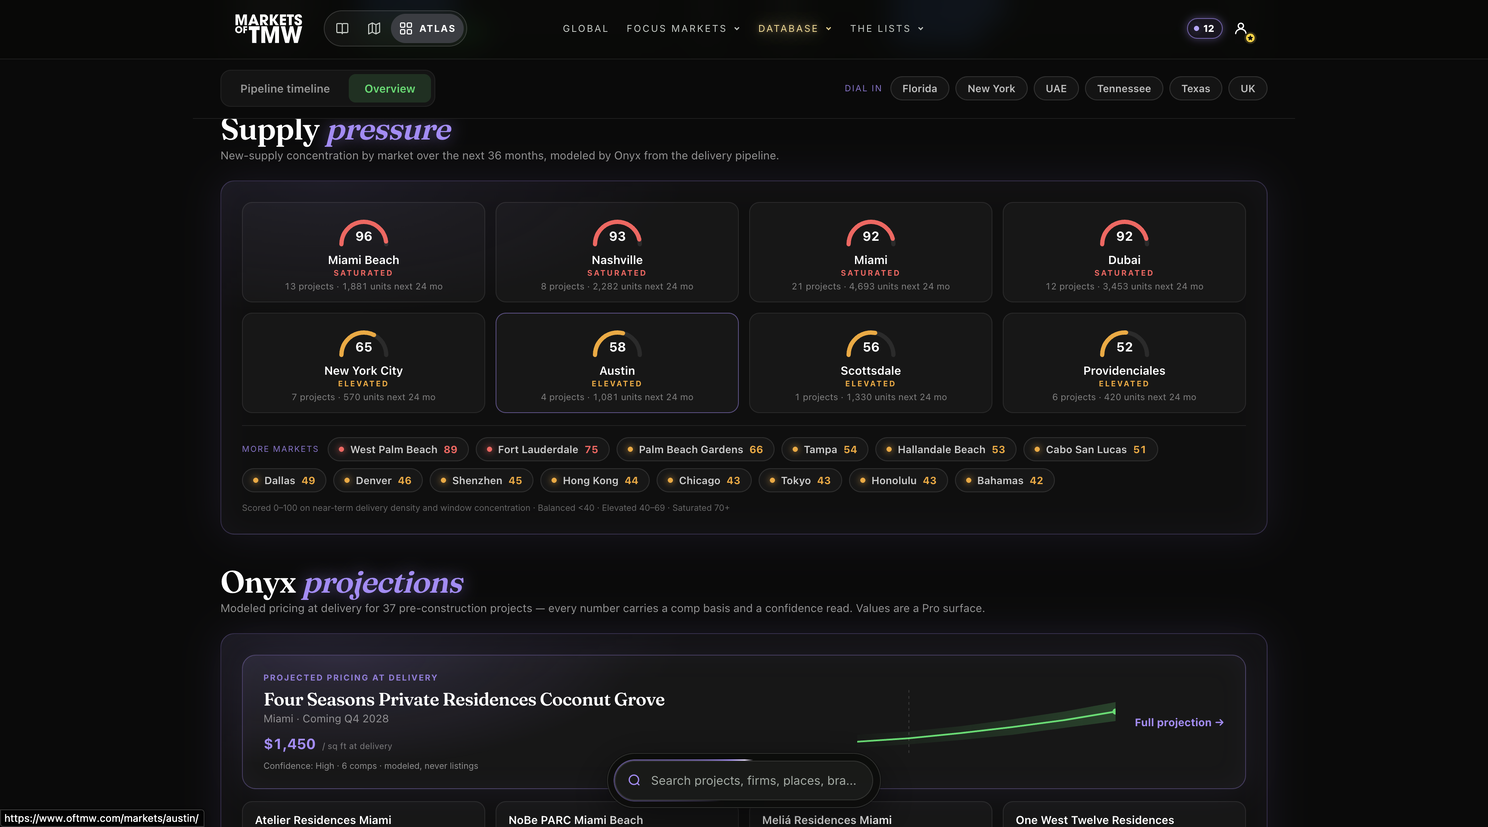
We built a projection layer on top of the verified pipeline. The first piece is supply pressure: a score, market by market, for how crowded the delivery calendar is getting. Miami sits at 92 out of 100, Saturated. Miami Beach 96. West Palm Beach 89 across 54 developments. New York, with a longer-dated pipeline, comes in at 65, Elevated. 87 markets modeled so far, each one reading its own forward calendar of what delivers, when, and how many units land in the same six-month window.
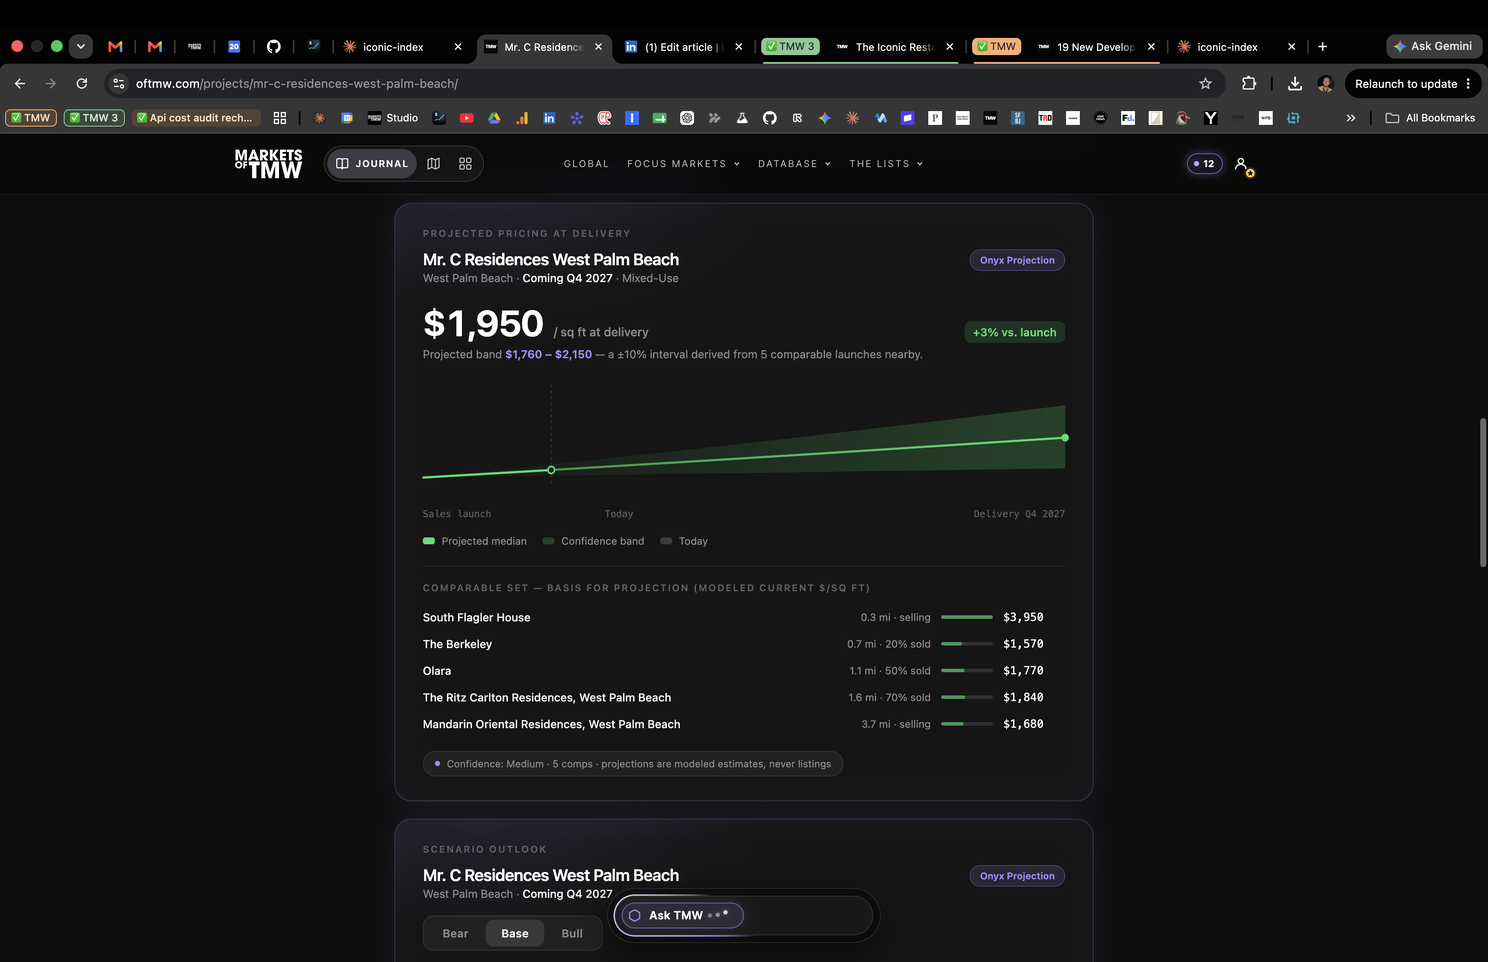
Then we went a layer deeper, onto individual buildings: modeled pricing bands, comped off nearby delivered inventory, appreciated out to delivery, with bear, base, and bull scenarios. Never a listing price; we do not show those. A defensible read on where a specific project prices when it opens, always labeled as modeled, always carrying its confidence.
Here is why this is a different animal than what came before. Anybody can tell you a tower was announced. A general model with no database will happily invent a number for you. Neither can tell you that a specific market is about to absorb more supply than it has ever delivered in a single year, because that requires knowing the real delivery date and the real square footage of every project in the pipeline, verified, at once. We own that. So the projection is ours to compute. The pipeline told you what is rising. Supply pressure tells you what that does to the market it is rising into. We took it bicoastal this week too, modeling New York alongside Florida, 520 Fifth Avenue and the rest.
The loop got a scoreboard
The quieter half of the week is the one I like more. Last week the learning loop got smarter every time a person corrected the machine. The obvious problem with a loop like that is you cannot see whether it is actually working. You are trusting that the corrections add up.
So this week we gave it a scoreboard. The brain now runs an honest experiment on itself. It writes a fresh draft of one of our best pieces with the learned brain switched on, writes the same piece with it switched off, and has a judge score both against the real published version. We can finally see the delta the loop is buying us, and we pin every score to the exact version of the brain that produced it. We also started measuring how much of the machine’s first draft survives all the way to the published piece, which is the cleanest quality signal we have.
Then the shift that matters. The loop stopped only learning from what got fixed and started learning from what worked. It now reads our best-performing published articles and our top Instagram posts, the ones that actually earned saves and shares, and distills the voice behind them back into the brain. Correction taught it what to avoid. Performance teaches it what to reach for. And the whole pipeline, the distillers, the self-tuning, the pruning, now runs itself on a weekly cycle with nobody pressing a button. A loop you cannot measure is a guess. This one grades its own homework and tunes toward the answer.
What this compounds toward
The map, the Atlas, and Onyx are live at www.oftmw.com, and the everyday layer is free, so you can open it right now, watch a skyline fill in year by year, and ask a question in plain English. TMW Pro is where it opens all the way: Deep mode, the full dossier on every project, and now the projection underneath a market, how crowded its calendar is, and where a building prices when it opens.